Custom Generated Art + Dropshipping: How I Built an Automated Business In 3 Days

Like all good things, this idea started from solving my own (my family’s) problems. In three days that need turned into a fully automated business. Let’s dive into the journey.
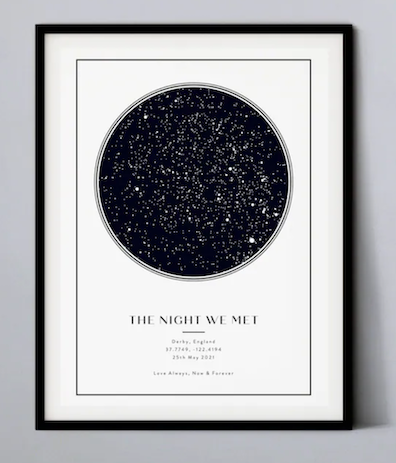
My sister is one of the most thoughtful people you’ll ever meet (happy to provide references) and wanted to get a bereavement gift for her friend whose father passed away. Looking through Etsy she came across a custom plaque that shows the star configurations on a certain day, a really sweet and personalized gift. I loved it but asked, “he loved to sail, is there a customized tide graph for his favorite spot on the special day instead?”. She loved the idea…only one issue, we couldn’t find it on Etsy.
I needed a project for the weekly blog project: The Stars had decided what I’d be working on 😉.
I immediately started working on it that night and tried to get the most crucial parts into place:
- Who could print/fulfill the order
- Where would I get the data
- What libraries are available to build the art.
All of these I knew had solutions or could be figured out, but I needed to get legitimate options for all three. I’d solve them all that night (low barrier to entry has its pros and cons).
Finding Who Would Handle Drop Shipping/Print On Demand (POD)
There was no shortage of options but I had a few requirements - in this order:
- Affordable (not necessarily cheap)
- Quick turnaround
- Good selection
- Not 💩 software
I looked at a few options and all seemed to fall short in one or more of the areas. I looked through a dozen and Printful was good but expensive, CustomCat was solid but the software/UI was weak (but was willing to overlook), and then Gelato was pretty solid overall. I placed an order on CustomCat and Gelato and within 12 hours it became clear: CustomCat was slow and Gelato was great, they had printed my mug in <24 hours and shipped it within 48 hours.
IMPORTANT NOTE: screw the best solution, you just need to move quickly, build, and get onto other problems. Test ideas and optimize later. To paraphrase a quote:
“In the beginning: speed > quality. Later on: quality > speed”.
Problem 1 solved, LET’S GOOOO!
Getting Data
I knew this data would exist somewhere but as we often find: the devil is in the details. So I poked around for a while and seemed to run into a bunch of dead-ends, incomplete data, no API (would need to make it more manual or build a web scraper), and then I found this government website which had almost exactly what I was looking for.
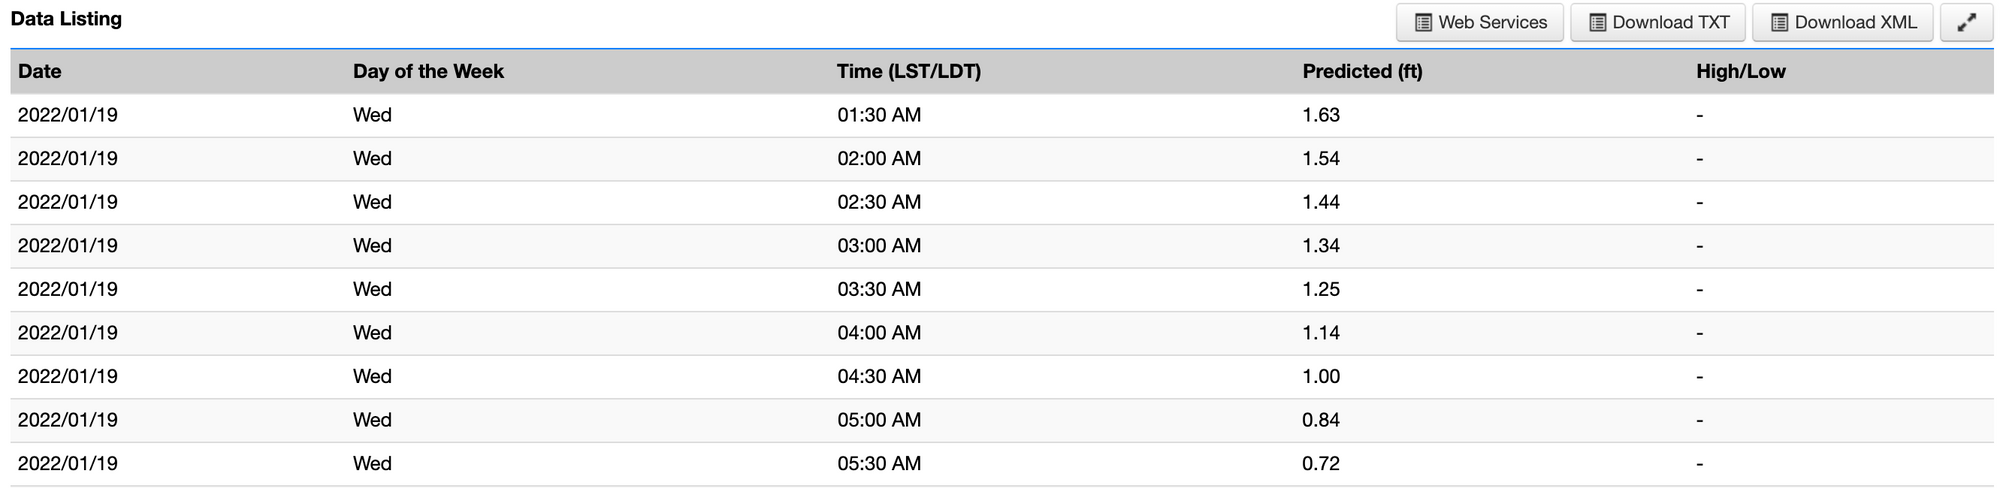
It’s not perfect but once again, this wasn’t a fundamental issue, so you know what we say? Problem 2 solved, LET’S GOOOO!
Building The Art
KISS - Keep It Simple Stupid. Once again let’s keep it simple and get things working to test the idea. It does need to be highly customizable for future iteration if it’s deemed needed.
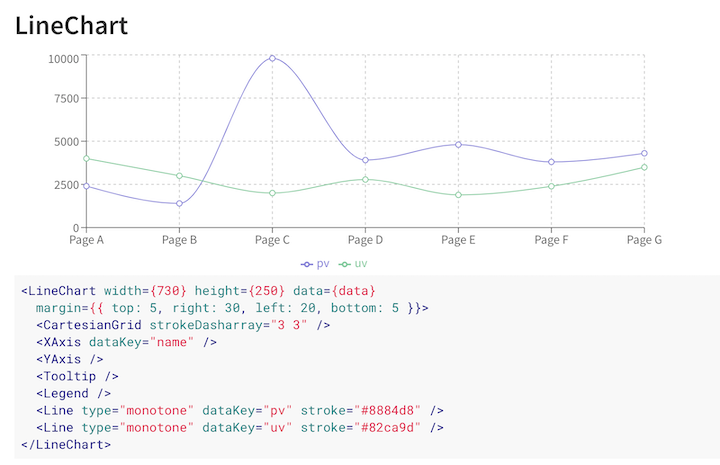
I Googled recommendations and looked at a few libraries like charts.js, HighCharts, ApexCharts, and a few paid options but they were not exactly what I was looking for. Finally after an hour and messing around with a bunch of options I came across Rechart which works with React. It seemed super customizable and had a good community of support around it. Problem 3 was solved……LET’S GOOO!
I had the pieces but now it was time to build it and put it all together.
Building
Now it was time to put in the sweat equity. Let’s jump it.
The first thing was I needed a place to build all this. My laptop has almost run out of memory (embarrassing I know) and I didn’t want to clog up my machine with dependencies. So like every good engineer: I built it in the cloud using CodeSandbox, which was awesome.
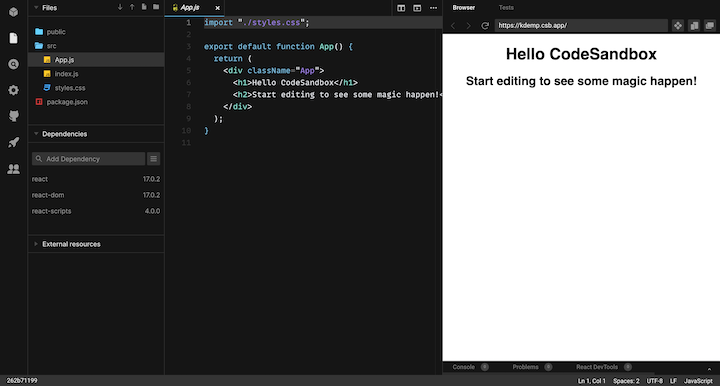
I could develop everything online, spend no time provisioning a server, no managing hosts, it integrates with GitHub - oh and it’s free. For a small project, it was a no-brainer.
The first thing I needed to do was get a base to work from. So I built the graph with dummy data. I looked through Recharts docs and copied a demo line chart. It worked almost immediately and I had my canvas. But there was a lot of work ahead. Now I need to make this graph pretty…dilate your eyes pretty.
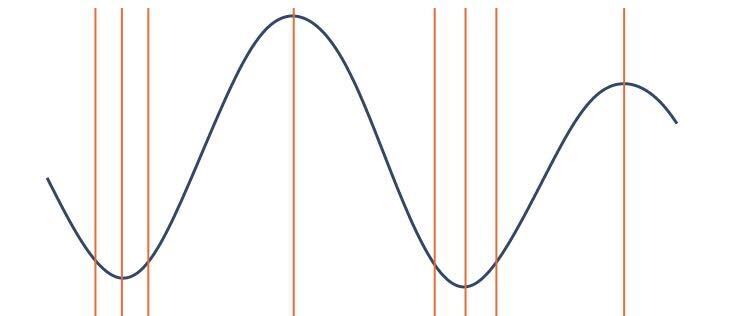
I needed to get rid of all the titles, dots, grids, and anything that made this graph look scientific. This was truly gonna be art and not science. I did need to mark highs and lows but we’d cross that bridge when we got there. Getting rid of the titles, dots, and grid was quick. And I quickly decided my graphs were gonna have vertical marker lines which were easy to add.
My React was rusty but like learning to ride a bike, you fall a few times and then you’re off to the races. So I had the foundation set, I had the API/data source, now it was time to get the data. I made the calls, got the data, put it in a format I needed, and wired things up with Rechart, and before I knew it, the graph was looking fineeee! I was super hyped but I knew more work was to come!
Now it was time to get the times of the high and low tides. I could have called a different API and got the data I needed. But I thought a better solution was to use what I have and use a simple algorithm. I have Stockholm Syndrome with formal algorithms and I wasn’t gonna pass up on a case to use the skills I’ve built.
The algorithm was simple but worked well. It looked through each data point and compared it to the point to the left and the right. If it was larger than both, we had a max (high tide). If it was lower than the neighbors, it was a min (low tide). Pretty quickly I got this working and now I had high and low tides marked on the graph! I was feeling like I might have hit my own...high tide.
I did some more testing on different locations and….ROADBLOCK. The data that’s collected is likely from automated buoys. This means with five min intervals you get imperfect data. I assume it’s from a wave but you can get a data point that is out of line with its neighbors. This makes the algorithm think there are a lot more highs and lows.
It was a quick hack but I just checked to make sure there wasn't a max or min within a few hours of the last one. FIXED!
Nice, so we have a single working graph, now let's make this thing dance with different time/location data!
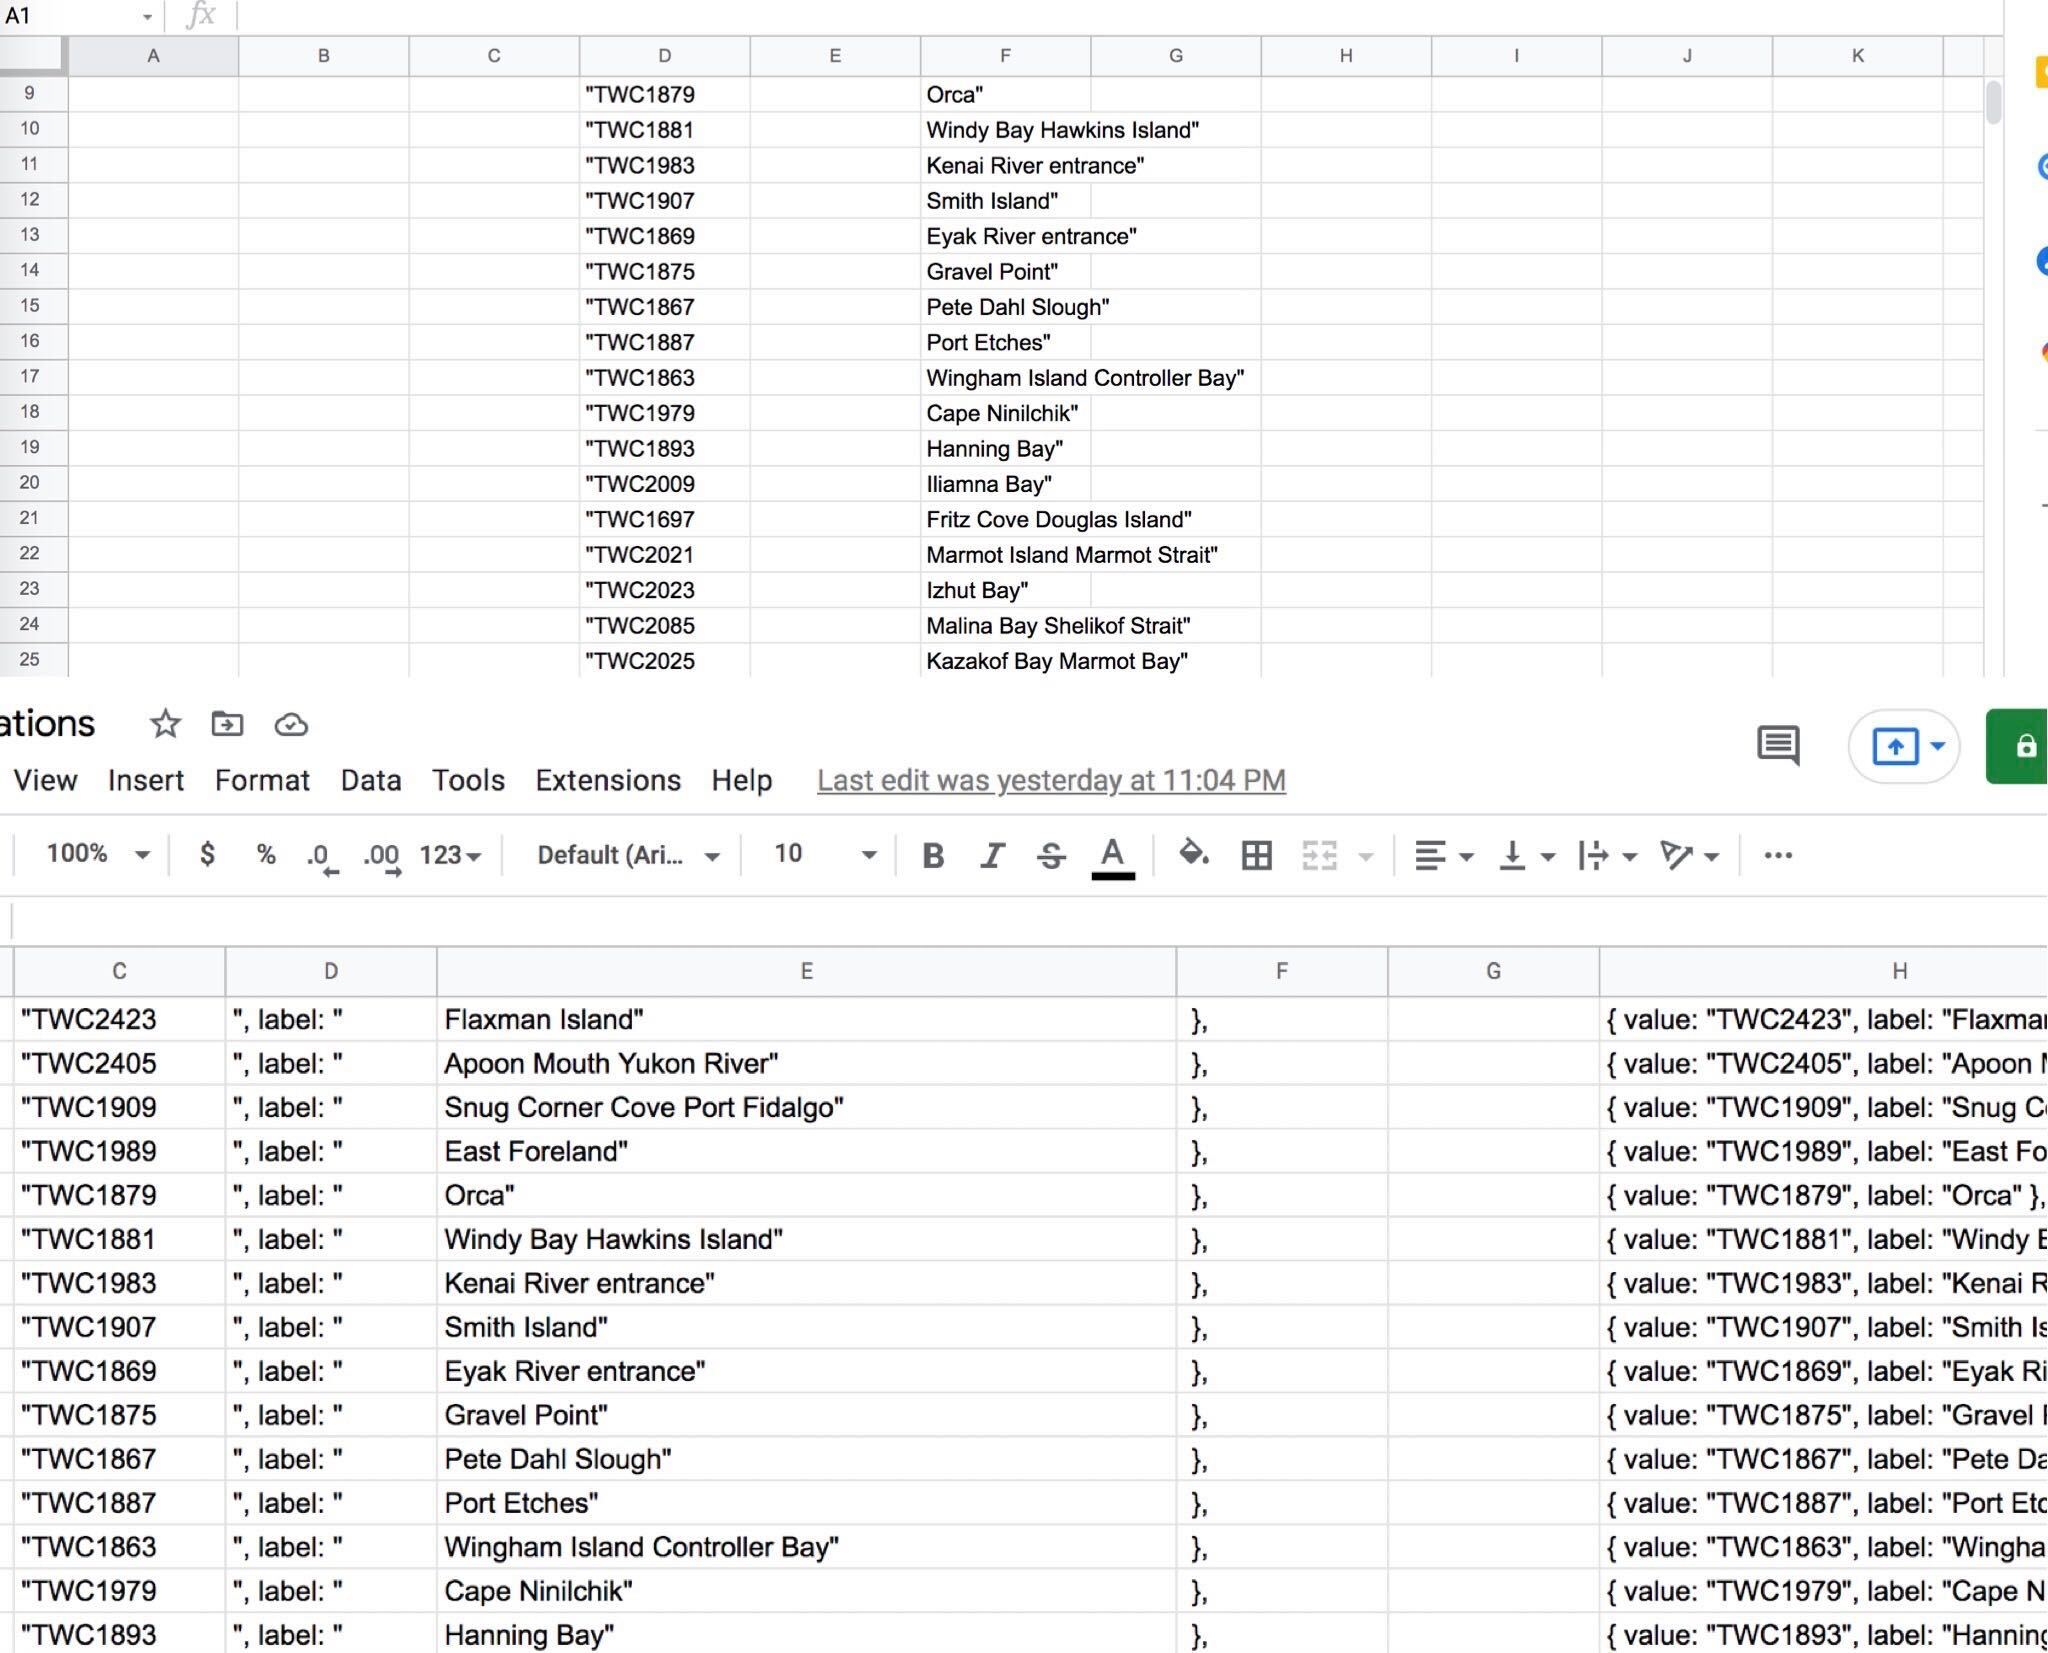
So I looked at the government site and they had a list of locations, but no way to get it from an API :shake-fist:. Note: I later discovered I could have gotten it from another one of their APIs, but the data still would have had to get cleaned. Regardless - itiswhatitis. So I wrote a quick little bit of JavaScript in the console to grab the list and exported the thousand sumtin list to Google Sheets. It did take a little bit of clever regex and column-wide formatting. But, I was able to get the list in JSON format to be used in the app. We were ready to integrate it.
Because I wanted to move fast (and am lazy) I used a lightweight library and got a search feature working! I strung it together in the app, added a date field, and I was done! I added a little more styling. Though tbh I’ll need to do more, it’s not as pretty as I hyped it up to be. I now had a fully functioning tide graph that would be auto-generated for any date and customized however I want! I could screenshot the graph or use a library to export the image for whatever I wanted.
Selling
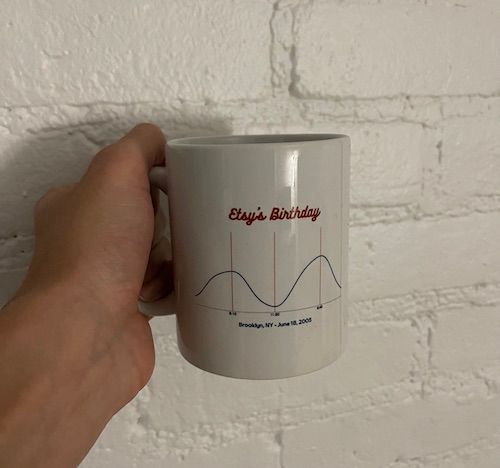
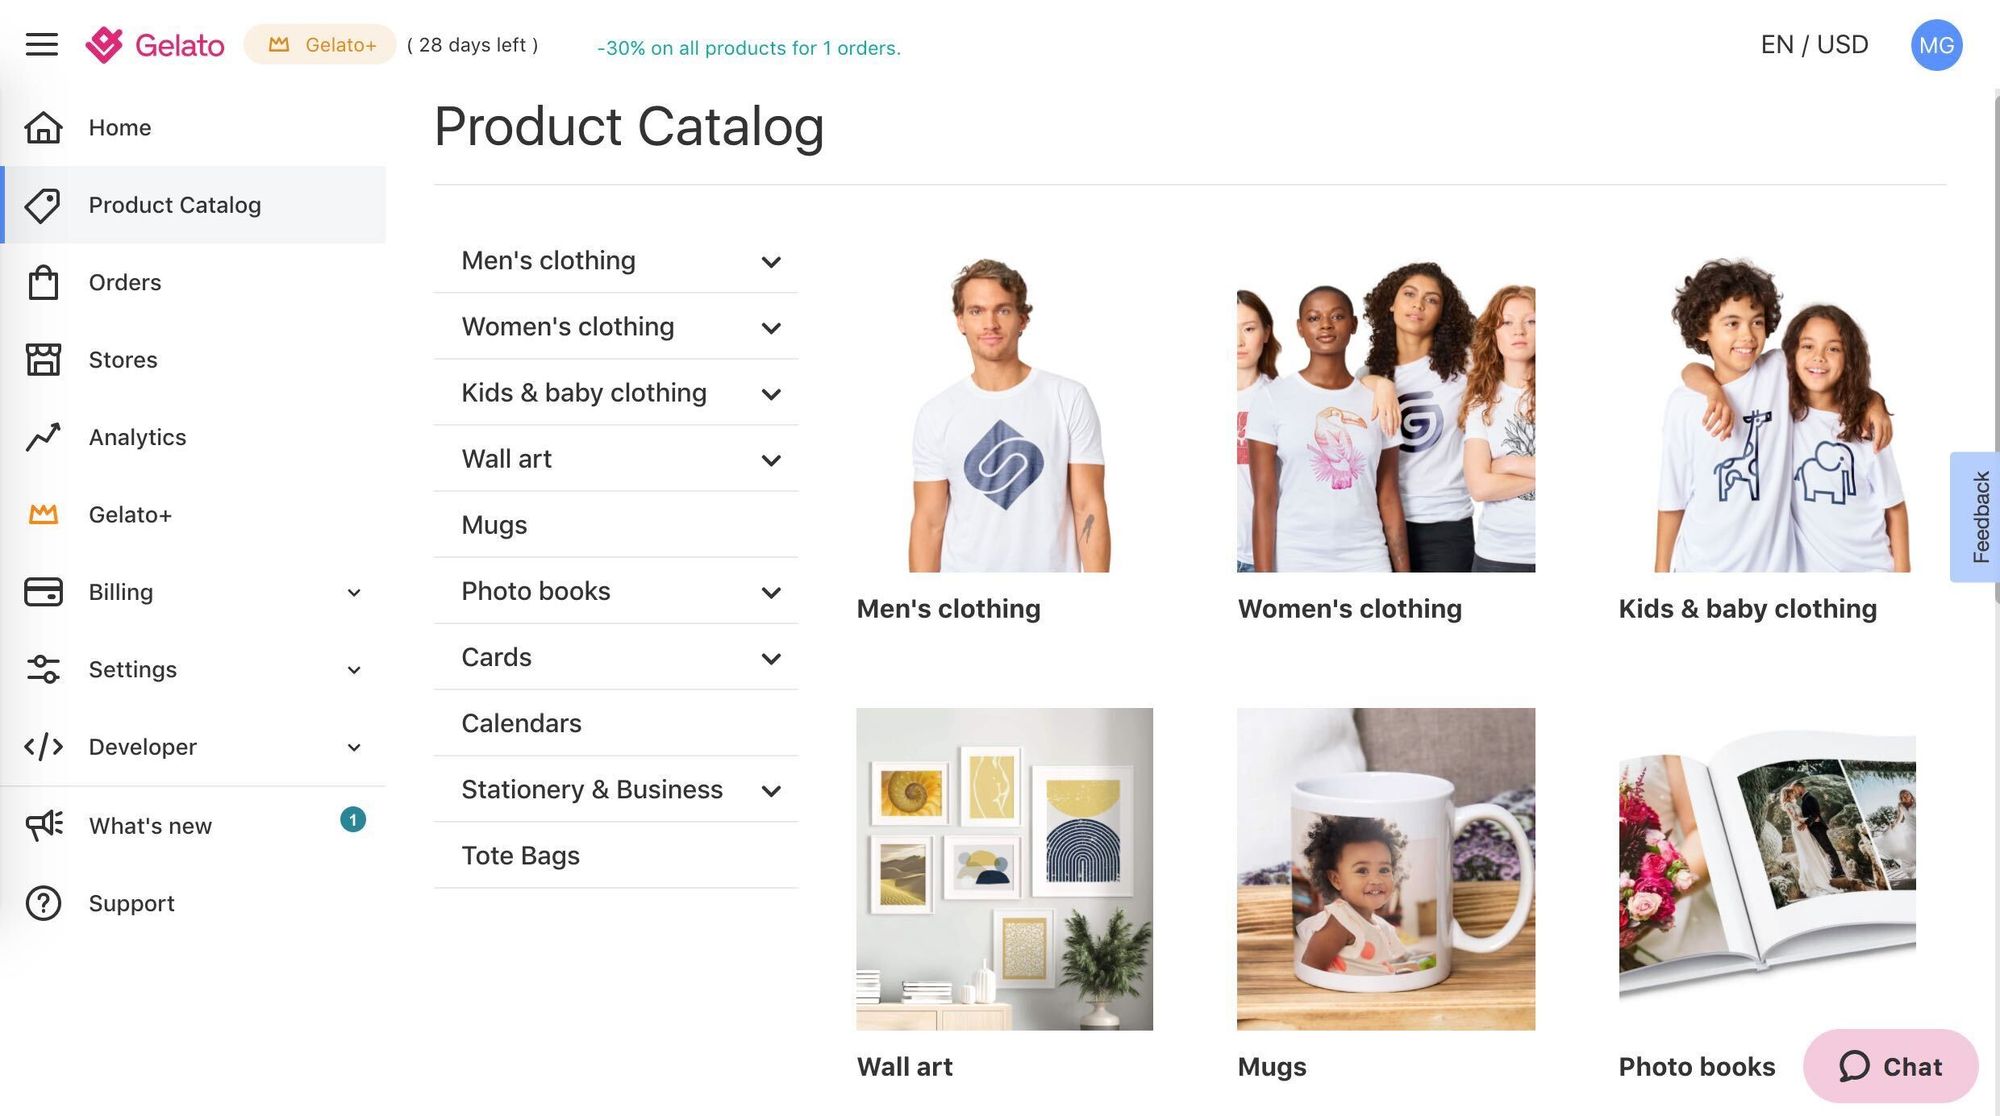
So now I had the graph, it was time to get this thing for sale! So I went on Gelato (POD service from above) and looked through their offerings and it seemed like a mug was a great option. It was cheap and similar items on Etsy had a high price tag.
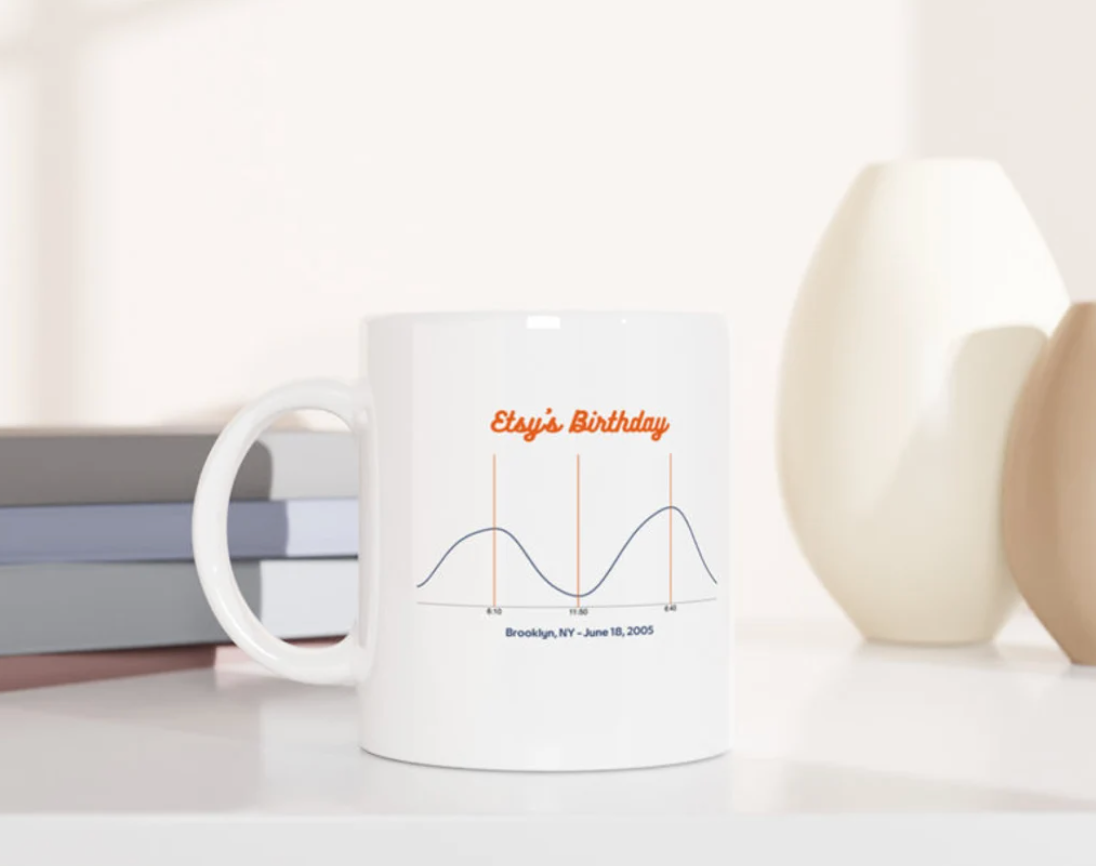
I quickly used Canva to throw some custom text around the graph and the item was looking good (in the future I could add this to the app). Using Gelato’s drag and drop editor, I quickly put the image on the mug and it was ready to go!
Gelato automatically generates a 3D model of the mug and great custom shots of the mug that are perfect for the Etsy listing. I saved a few, and now it was time to open the shop.
I went on Etsy and started onboarding as a shop. It’s super easy, just some personal information and then you’re ready to make your listing. I used the images Gelato generated and a screen recording of the 3D model of the mug. Then I used copy.ai to generate some copy for the offering and then using other successful listings as a template added my own personal touch. Result: the description sucked.
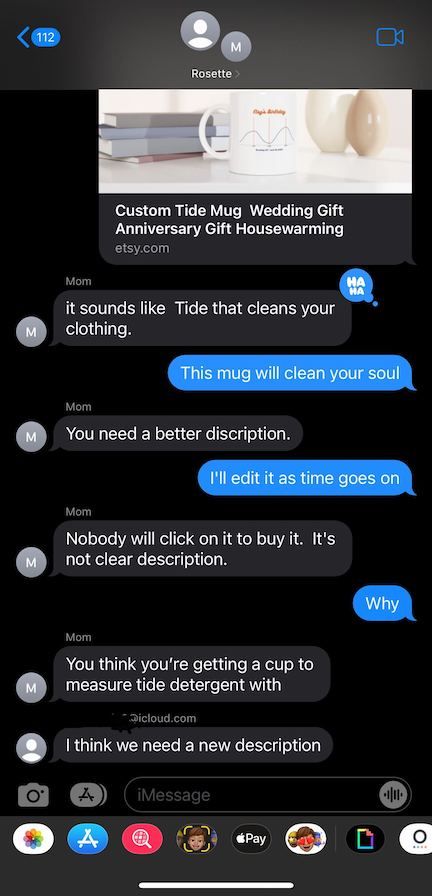
I’d probably use Fivver or Upwork to get some help with better copy if I was more serious about my shop and its future.
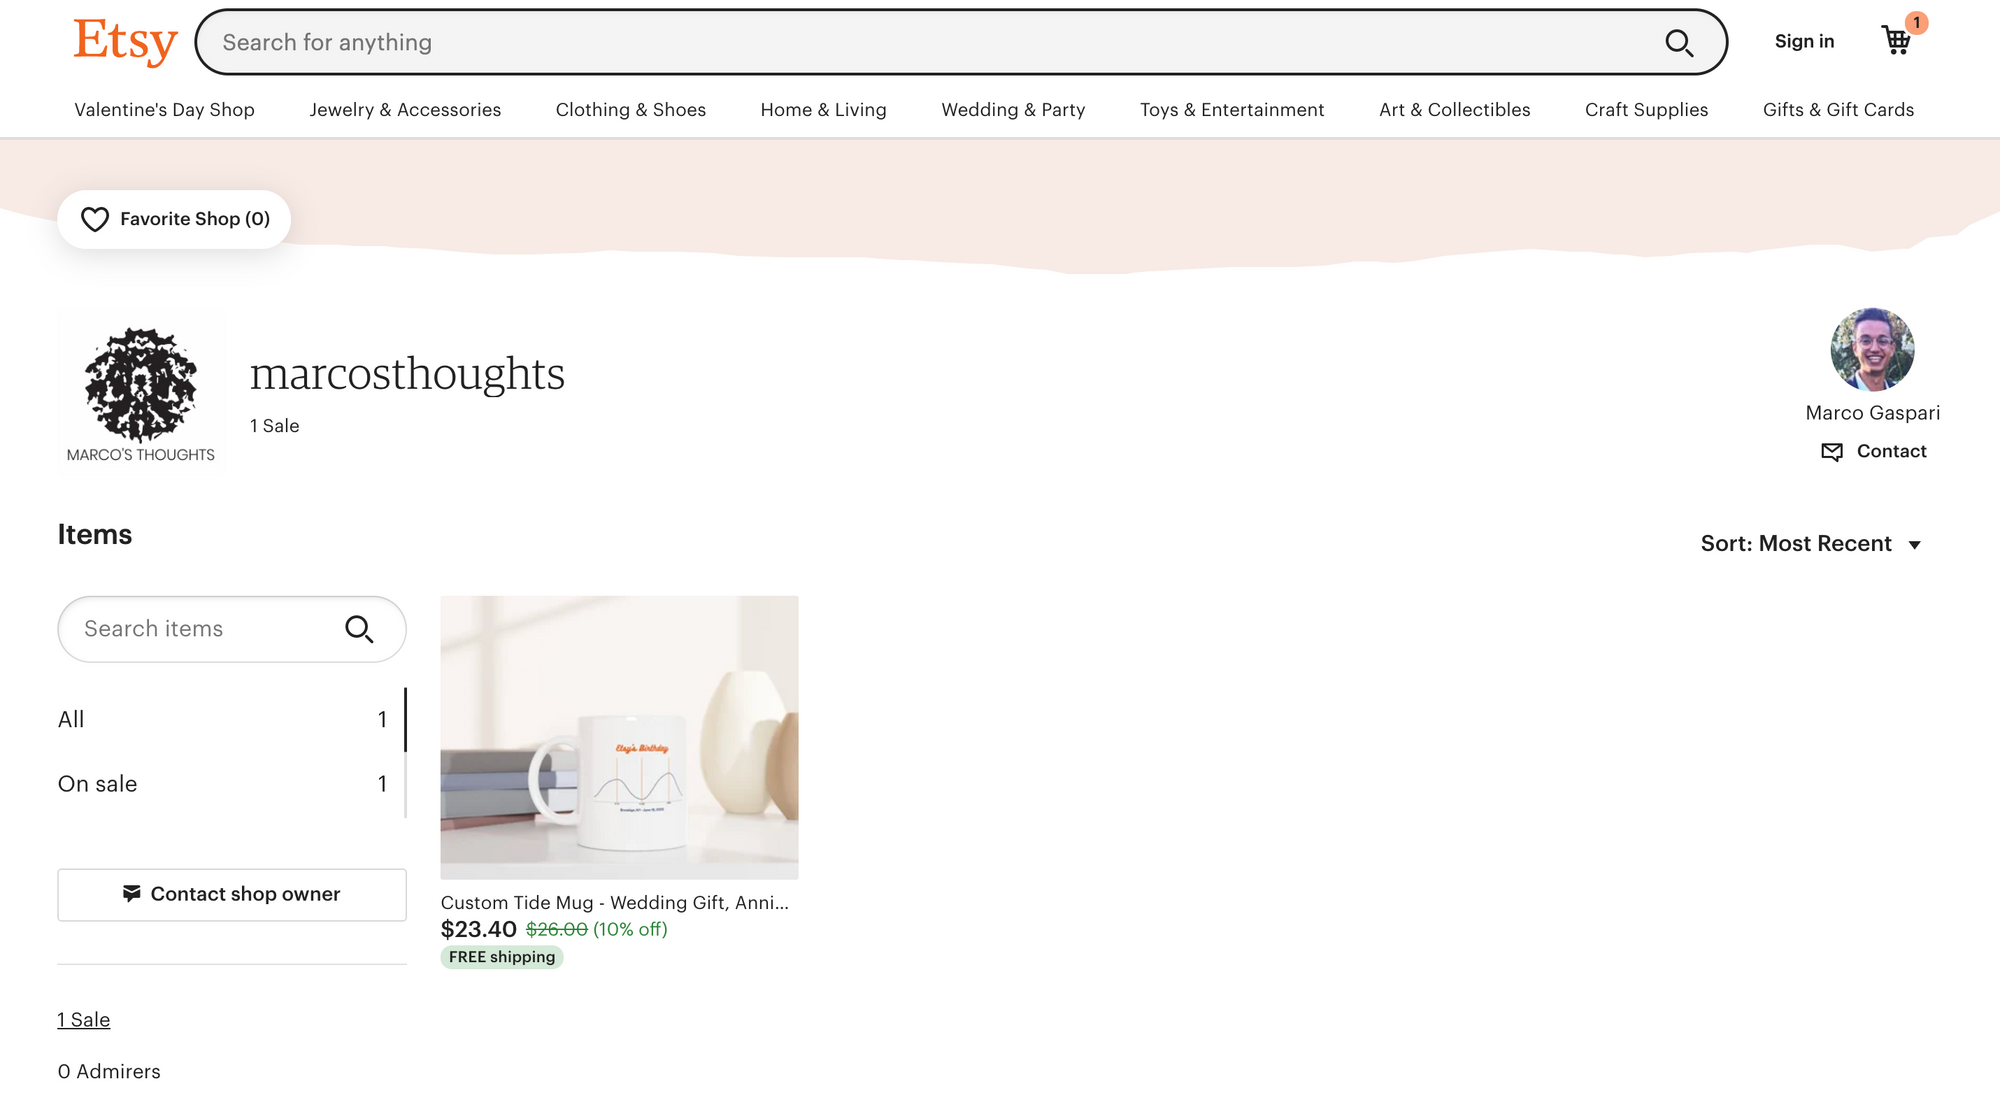
I then fully opened the shop, set up my listing to have ads run, and ran a tiny sale to make it as appealing as possible. Before I knew it the product was live!
Here is the flow of how an order would work:
- Buyer places an order on Etsy
- Using the data and location they gave I generate a graph
- I put that graph on Canva and add some custom text (as mentioned, I could easily add this to the app)
- Export that image
- On Gelato, I upload the photo, enter the shipping info of the buyer, and pay for the mug
- Gelato will print the image on a mug and send out the package to the buyer without me lifting a finger
- Gelato sends me the shipping number which I attach to the Etsy order
- The user gets the package
Gelato allows for some of these steps to be automated but I haven’t explored all the integrations yet. With that said, almost all of this is automated or so simple it could be done by a smart dog for a few bags of Begginstrips.
So what are the results?
Financials per mug:
Costs:
Mug - $5
Shipping - $4
Etsy fee - $2
Revenue:
Mug - Average $23
Profit:
$12
Time:
<5 minutes
I can expand this to more items like wall art, totes, keychains, etc. The custom art for each order takes <30 seconds per order, and the whole process in minutes. So once everything is set up, it’s roughly $10 for <5 min of work, and it can be automated even more. My plans are to let this run for a bit with some more offerings, make the graph look prettier, and see where things go!
I learned a ton during this build:
From a business standpoint - how to string a few simple solutions and a little code to make an incredible item.
From a code standpoint - how to build dynamic custom graphs, refresh my React, work with messy data, and just build an end-to-end product that has real use. In general also just learning how to move quickly and ship.
With an up-front investment in time, this is a fully functional business! It has a lot of potential, is super scalable, and with some updates, it could be a successful brand!
Check out my shop here (still WIP) and make an order. It's a great item if you want to remember a special moment near the water and/or if you want to support the blog!
UPDATE
The sample mug came!